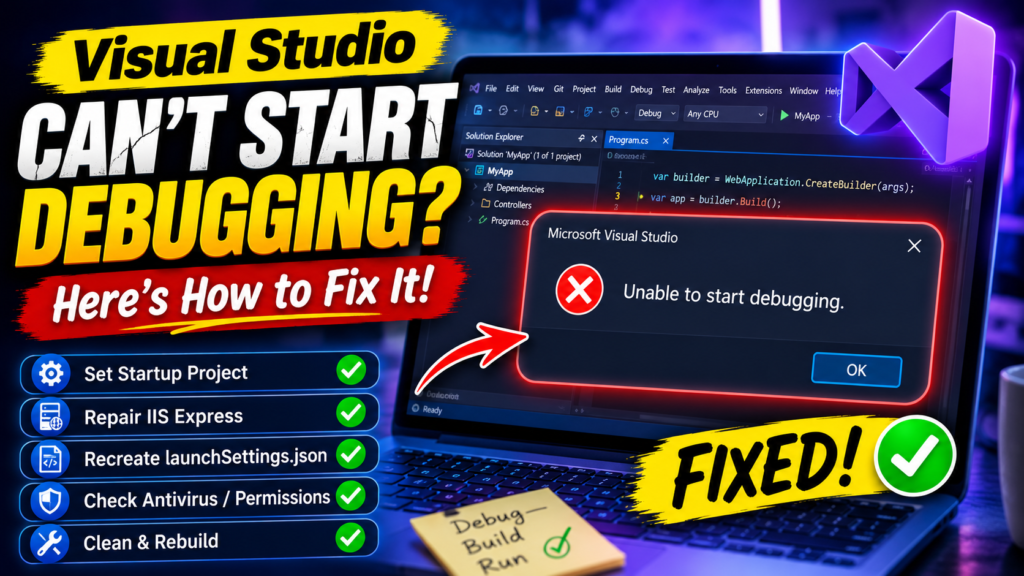

Pressing F5 in Visual Studio should normally launch your application in debugging mode. But sometimes, instead of running the project, Visual Studio displays an “Unable to start debugging” error.
The good news is that this problem is often related to project configuration, startup settings, IIS Express, corrupted launch settings, or security software rather than your actual code.
Here are the most effective ways to fix the Visual Studio unable to start debugging problem.
Quick Tips
- Make sure the correct project is selected as the Startup Project.
- Check your debugging configuration and make sure the required debugger is enabled.
- Repair IIS Express if you’re working with an ASP.NET or PHP project.
- Recreate a corrupted
launchSettings.jsonfile. - Run Visual Studio as an administrator if it doesn’t have sufficient permissions.
- If security software is interfering with debugging, use an appropriate exclusion rather than leaving real-time protection disabled.
Fix 1 – Set the Correct Startup Project
If your Visual Studio solution contains multiple projects, Visual Studio needs to know which project should launch when you press F5.
If the wrong project is selected, you may encounter an Unable to start debugging error.
Step 1. Select Your Project
Open Solution Explorer and locate the project you want to run.
Step 2. Set It as the Startup Project
Right-click the project and select Set as Startup Project.
Step 3. Check the Project Properties
Right-click the same project again and select Properties.
Open the Debug section and check that the appropriate debugging configuration is enabled.
For web projects, the relevant options may appear under the Web or launch settings section depending on your project type and Visual Studio version.
For C++, Python, and Node.js projects, check that the appropriate launch and debugger options are configured.
Step 4. Try F5 Again
Save your changes and press F5.
If the application launches normally, the problem was most likely caused by an incorrect startup configuration.
Fix 2 – Repair IIS Express
If you’re working with an ASP.NET or other web project that uses IIS Express, a damaged or incorrectly configured IIS Express installation can prevent Visual Studio from launching the debugger.
Step 1. Open Installed Programs
Search Windows for Installed apps and open it.
Alternatively, you can open Apps > Installed apps from Windows Settings.
Step 2. Find IIS Express
Search the installed applications list for IIS Express.
Step 3. Repair the Installation
If Windows provides a Repair or Modify option, use it and follow the instructions.
Restart your PC after the repair finishes.
Step 4. Check Visual Studio Settings
Open Visual Studio and go to:
Tools > Options
For applicable web projects, check the web project/debugging settings and verify that the correct IIS Express configuration is being used.
Try pressing F5 again.
Fix 3 – Recreate the launchSettings.json File
Visual Studio uses launchSettings.json to store important launch and debugging configuration for many .NET projects.
If this file contains incorrect or corrupted settings, the debugger may fail to start.
Step 1. Close Visual Studio
Save your work and completely close Visual Studio.
Step 2. Open Your Project Folder
Use File Explorer to navigate to the folder containing your Visual Studio project.
Step 3. Find launchSettings.json
For many .NET projects, the file is located inside:
Properties\launchSettings.json
Depending on the project, launch-related configuration can also be stored elsewhere.
Step 4. Back Up the File
Before deleting anything, make a backup copy of launchSettings.json.
If you’re certain the file is causing the problem, you can then remove it and allow Visual Studio or your project tooling to recreate the required configuration.
Step 5. Reopen Visual Studio
Open the solution again and rebuild it.
Go to:
Build > Rebuild Solution
Then press F5.
Tip: Don’t delete the entire project or
.vsfolder unnecessarily. Only remove configuration files when you’re confident they’re causing the problem.
Fix 4 – Run Visual Studio as Administrator
Sometimes Visual Studio or the debugger may not have sufficient permissions to access files, services, ports, or other resources required by the project.
Step 1. Close Visual Studio
Make sure all Visual Studio windows are closed.
Step 2. Find Visual Studio
Open the Start menu and search for Visual Studio.
Step 3. Run as Administrator
Right-click Visual Studio and select Run as administrator.
Confirm the User Account Control prompt.
Step 4. Open Your Project
Load the solution and press F5.
If debugging works only with administrator privileges, investigate which file, folder, service, or development component requires elevated permissions rather than permanently running Visual Studio as administrator.
Fix 5 – Check Antivirus and Windows Security
Security software can occasionally interfere with development tools by blocking processes, files, network connections, or temporary files used during debugging.
Instead of permanently disabling your antivirus, first check whether it has blocked Visual Studio or one of its debugging components.
Step 1. Open Windows Security
Search for Windows Security and open it.
Step 2. Check Protection History
Go to:
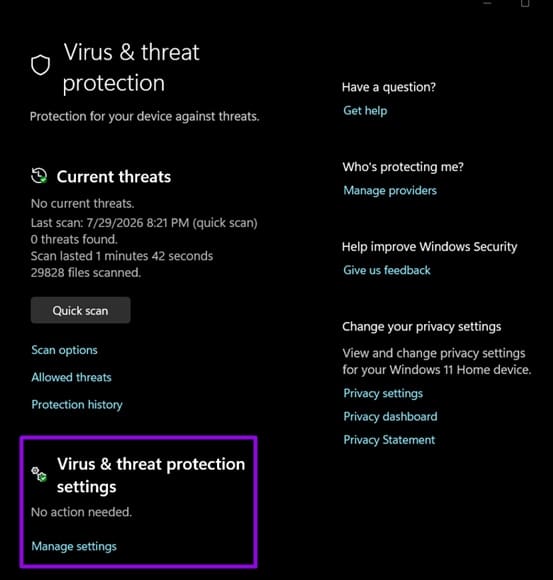
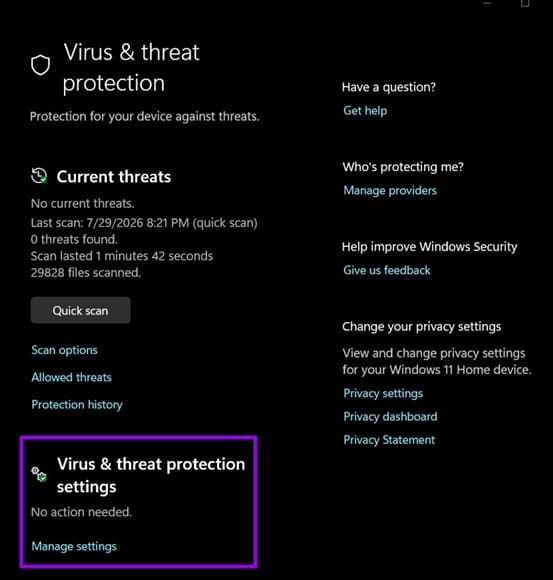
Virus & threat protection > Protection history
Look for recent detections or blocked actions involving Visual Studio, your development tools, or project files.
Step 3. Review Your Security Settings
If you identify a legitimate Visual Studio component being blocked, follow your security software’s process for creating an appropriate exclusion.
Only add exclusions for files, folders, or processes you trust.
Step 4. Test Visual Studio Again
Restart Visual Studio and press F5.
If your security software was responsible, debugging should now work normally.
Fix 6 – Clean and Rebuild the Solution
A stale build can sometimes cause debugging problems even when your project configuration looks correct.
Step 1. Open Visual Studio
Load the affected solution.
Step 2. Clean the Solution
Select:
Build > Clean Solution
Wait for the operation to finish.
Step 3. Rebuild the Project
Go to:
Build > Rebuild Solution
Step 4. Start Debugging
Press F5 or select Debug > Start Debugging.
Fix 7 – Check Your Debugger Configuration
If Visual Studio still can’t start debugging, check whether the project is configured to use the correct debugging method.
Depending on your project type, Visual Studio may provide options for:
- Project launch
- IIS Express
- Local web server
- Executable launch
- Managed debugging
- Native debugging
- JavaScript debugging
Open your project’s Properties and review the Debug section.
Make sure the selected launch profile matches the type of application you’re developing.
Final Thoughts
The “Unable to start debugging” error in Visual Studio can be frustrating, but it is usually possible to resolve without changing your application code.
Start with the simplest solutions: set the correct Startup Project, check the debugging configuration, clean and rebuild the solution, and restart Visual Studio. If you’re working with a web project, also check IIS Express and your launch profile.
If the problem continues, inspect launchSettings.json, Windows Security, and your project’s debugging configuration. These checks can help identify whether the issue is caused by the project, Visual Studio, or another Windows component.